
Introducing the CFB Stat-Finder App
Primer on my newest app creation

I dropped another new app today, and it is one I will be utilizing plenty for content this year: the CFB Stat-Finder.
The Stat-Finder is great because it is loaded with information on anyone who has played Division 1-A football since 2000 (with 2020 stats coming at the conclusion of the college season). The app comes complete with 38 different data-points, and allows you to view them on either a single-season or career level. Here’s a look at Tee Higgins’ career prior to coming out of Clemson last year:

You can see that the app gives the optionality to look at a player’s career year-by-year, or in the aggregate. This should make comparing players quite easy. Here’s Higgins along with two other alphas from the 2020 class: Justin Jefferson and CeeDee Lamb:
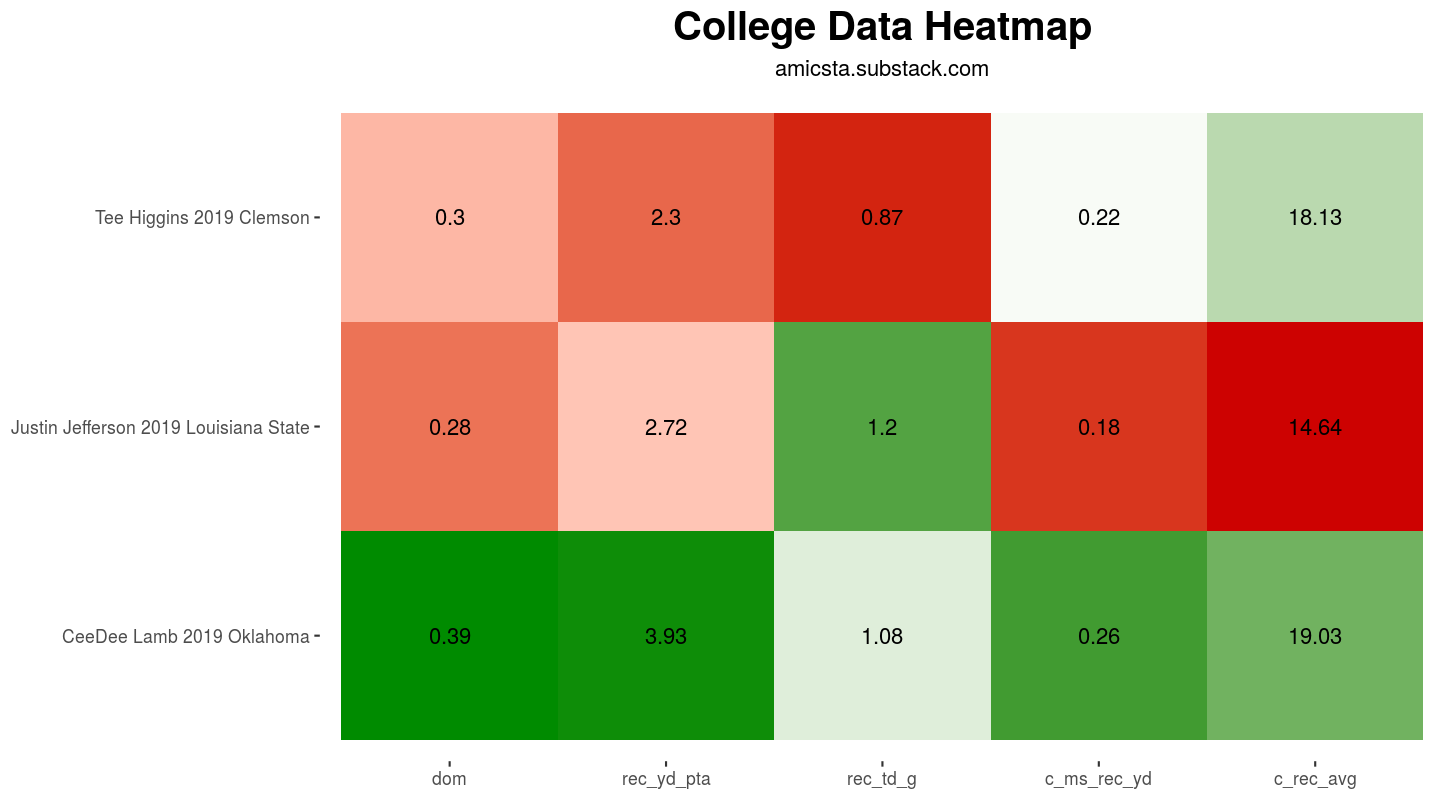
The heatmaps are localized, so you can quickly see the best and worst of any stat comparison. Lamb makes any prospect look pedestrian, but if we swap him out with Jalen Reagor, the colors change:

Career stats are computed in three main ways:
Per-Game: total statistic/total games played
Market Share/Opportunity: average of each season
Efficiency: total statistic/total attempts
Most of this is intuitive, though you may not expect the calculation of market share statistics to come as a career average. This is the “old RotoViz” method, and one that I prefer. I have used, for example, total receiving yards/total team receiving yards in the past, but found it skewed the numbers towards the seasons with higher team volume. This seemed counter-productive to me, since that is out of the player’s control.
The CFB Stat-Finder should be a go-to tool for prospect evaluation. Once I have added the 2020 data, I may play around with a similarity feature that allows you to find the most comparable prospects — much like my NBA Similarity App.
Glossary of Statistics
In case they are not immediately obvious, these are the 38 statistics currently used in the app. Career stats will simply have a prefix of “c_”.
pass_pct: Completion percentage
rush_avg: Yards per carry
rec_avg: Yards per reception
kr_avg: Kick return average
pr_avg: Punt return average
game: Games played
ms_rush_att: Market share of rush attempts
ms_rush_yd: Market share of rushing yards
ms_rush_td: Market share of rushing touchdowns
ms_rec_rect: Market share of receptions
ms_rec_yd: Market share of receiving yards
ms_rec_td: Market share of receiving touchdowns
ms_scrim_yd: Market share of scrimmage yards
ms_scrim_td: Market share of scrimmage touchdowns
ms_touches: Market share of team touches
dom: Dominator rating, average of ms_rec_yd and ms_rec_td
rec_yd_pta: Receiving yards per team pass attempt
rec_td_pta: Receiving touchdowns per team pass attempt
adj_ypp: Adjusted yards per play, (2*receiving yards + rush yards)/plays
pass_comp_g: Completions per game
pass_att_g: Pass attempts per game
pass_yd_g: Pass yards per game
pass_td_g: Pass touchdowns per game
pass_int_g: Pass interceptions per game
rush_att_g: Rush attempts per game
rush_yd_g: Rushing yards per game
rush_td_g: Rushing touchdowns per game
rec_rect_g: Receptions per game
rec_yd_g: Receiving yards per game
rec_td_g: Receiving touchdowns per game
kr_ret_g: Kick returns per game
kr_yd_g: Kick return yards per game
kr_td_g: Kick return touchdowns per game
pr_ret_g: Punt returns per game
pr_yd_g: Punt return yards per game
pr_td_g: Punt return touchdowns per game
pass_ypa: Pass yards per attempt
pass_aya: Adjusted yards per pass attempt (PFR definition)